
Tutorial
How to Monitor DNS Records of a Domain for Changes

Written By Qasim, WhoisFreaks Team Published: October 01, 2026, Last Updated: October 01, 2026
Tutorial
Written By Qasim, WhoisFreaks Team Published: October 01, 2026, Last Updated: October 01, 2026
DNS monitoring means noticing, within minutes rather than months, that a domain's A record moved to a new host, its MX records switched mail providers, or an SPF record quietly gained a new include:. This tutorial shows you how to build that yourself on top of the WhoisFreaks DNS API: poll the live endpoint on a schedule, diff the records against the last run, and alert only when something actually changed.
You'll need an API key. If you don't have one yet, sign up and grab your key first; new accounts include 500 free credits.
WhoisFreaks has a hosted Domain Monitoring product, and it is the easier path; but it watches the wrong layer for this job. It compares WHOIS fields between checks, and its Excluded Fields panel says so when you open it: "Select WHOIS fields you want the monitor to ignore."
| You want to catch | Hosted Domain Monitoring | Polling the DNS API yourself |
| Registrant or registrar change | Yes | No |
| Expiry date shift, status change | Yes | No |
| Nameserver delegation change | Yes (name_servers is a WHOIS field) | Yes (NS records) |
| A / AAAA record repointed | No | Yes |
| MX records changed | No | Yes |
| TXT, SPF, DKIM or DMARC edited | No | Yes |
| CNAME or SOA changed | No | Yes |
| TTL dropped before a migration | No | Yes |
If you only need to know when a domain is about to expire or changes hands, stop here and follow How to Set Up Domain Monitoring on WhoisFreaks instead; a few clicks, no code. If you need to know when the records themselves change, keep reading.
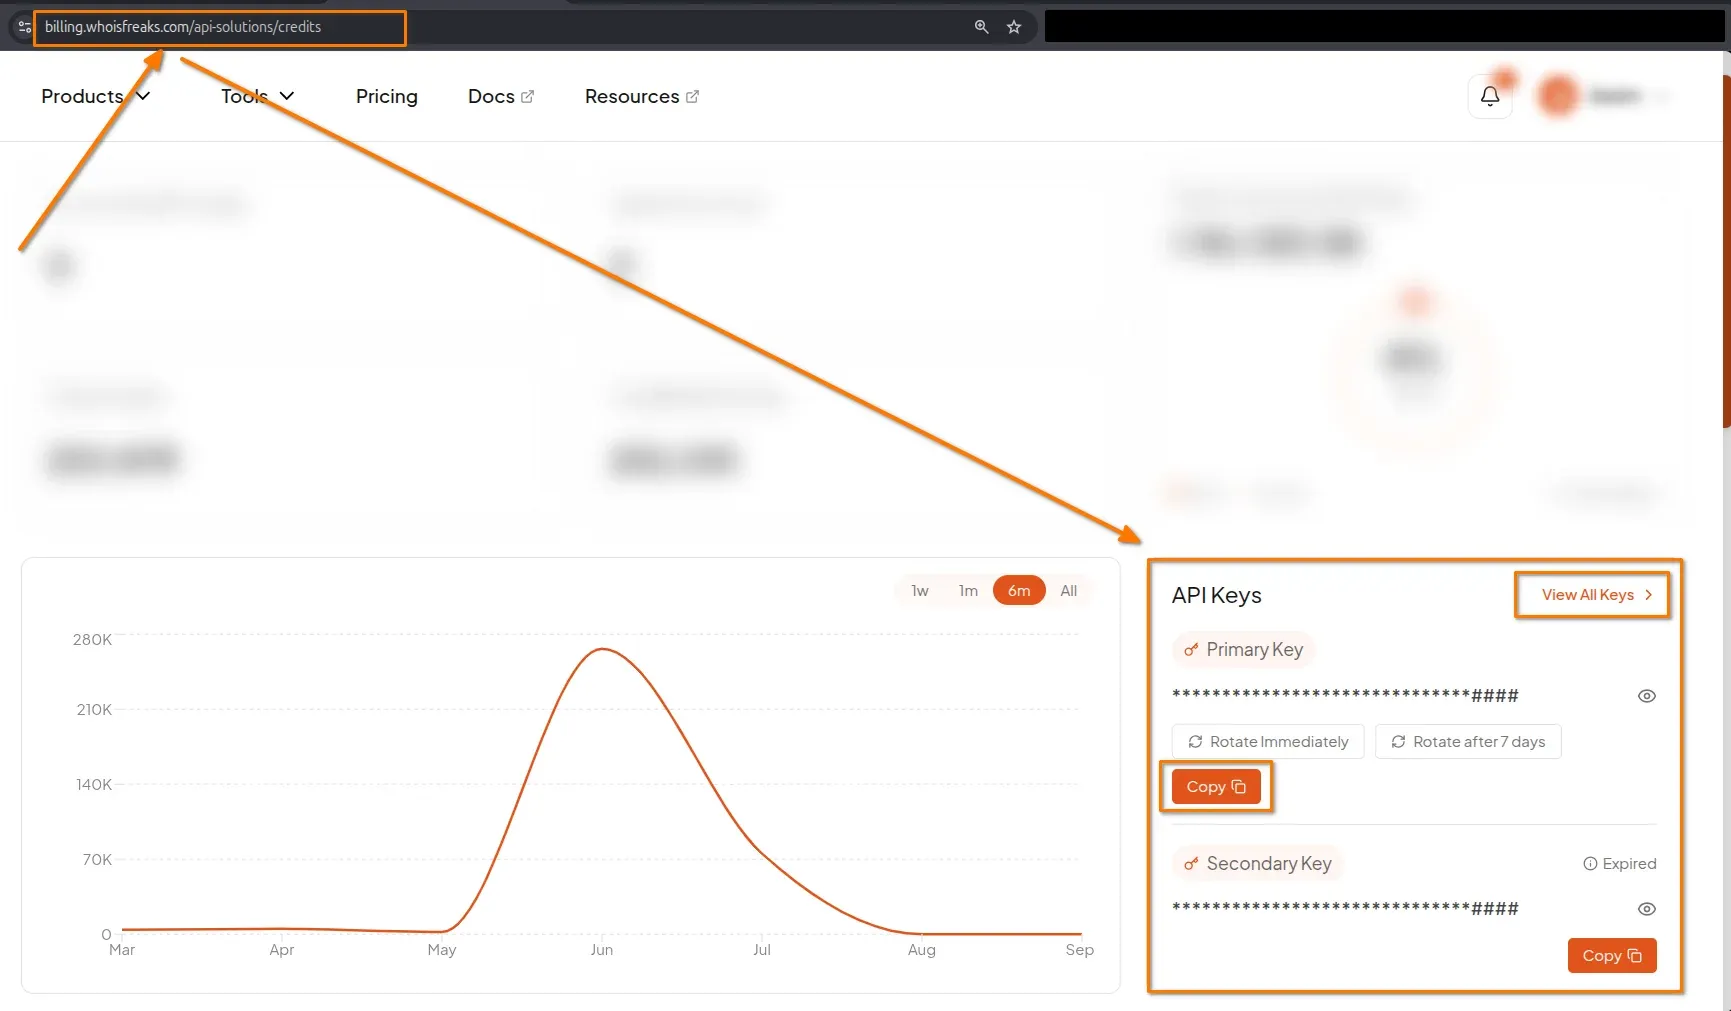
Sign in to the WhoisFreaks dashboard and open API Keys. Copy your primary key; it's the only credential the DNS API needs, passed as the apiKey query parameter.
Store the key in an environment variable rather than in the script. A monitor runs unattended for months, and a key in a cron file eventually ends up in a backup.
A monitor is a comparison against something you already have, so record what "normal" looks like first. One live lookup with type=all gets the whole zone:
curl -L --max-time 3600 "https://api.whoisfreaks.com/v2.0/dns/live?apiKey=API_KEY&domainName=whoisfreaks.com&type=all" -o baseline.jsonThe response carries a summary block, then the records:
{
  "queryTime": "2026-07-30 09:51:24",
  "domainName": "whoisfreaks.com",
  "dnsTypes": {
    "A": 1,
    "NS": 2,
    "SOA": 6,
    "MX": 15,
    "TXT": 16,
    "AAAA": 28,
    "SPF": 99
  },
  "dnsRecords": [
    {
      "name": "whoisfreaks.com",
      "type": 1,
      "dnsType": "A",
      "ttl": 300,
      "rawText": "whoisfreaks.com.\t300\tIN\tA\t188.114.96.0",
      "rRsetType": 1,
      "address": "188.114.96.0"
    },
    {
      "name": "whoisfreaks.com",
      "type": 2,
      "dnsType": "NS",
      "ttl": 21600,
      "rawText": "whoisfreaks.com.\t21600\tIN\tNS\talbert.ns.cloudflare.com.",
      "rRsetType": 2,
      "singleName": "albert.ns.cloudflare.com."
    },
    {
      "name": "whoisfreaks.com",
      "type": 15,
      "dnsType": "MX",
      "ttl": 300,
      "rawText": "whoisfreaks.com.\t300\tIN\tMX\t0 whoisfreaks-com.mail.protection.outlook.com.",
      "rRsetType": 15,
      "target": "whoisfreaks-com.mail.protection.outlook.com.",
      "priority": 0
    }
  ]
}| Field | Why the monitor needs it |
| dnsRecords[].rawText | The record exactly as DNS returned it. This is what you diff. |
| dnsRecords[].dnsType | Groups the diff by record type so an alert reads "MX changed", not "record 7 changed". |
| dnsTypes | The inventory of types present. A type disappearing from this map is itself an event. |
If you'd rather not start from an empty slate, see Step 6; the historical endpoint gives you a dated backlog before your monitor has ever run.
This is the one design decision that decides whether your monitor is trustworthy.
Each record object carries type-specific fields; address for A and AAAA, singleName for NS and CNAME, target and priority for MX, strings for TXT and SPF, and host/admin/serial/refresh/retry/expire/minimum for SOA. Diffing those means a comparison rule per record type, and any type you forget silently stops being monitored.
rawText sidesteps all of it. It is present on every record regardless of type, and it preserves the exact form DNS returned; including the TTL, so a drop from 3600 to 60 seconds shows up as a change too. That is a feature: operators lower TTLs shortly before they move infrastructure.
Treat the records as an unordered set of rawText strings, not a list. The API returns two A records for the sample domain and their order is not guaranteed, so comparing arrays positionally produces phantom changes. Compare sets and you get three outcomes per run: added, removed, unchanged.
# dns_monitor.py

import json, os, pathlib, sys, urllib.error, urllib.parse, urllib.request

API_KEY = os.environ["WF_API_KEY"]
STATE = pathlib.Path("dns-state")

def fetch(domain, rtype="all"):
    qs = urllib.parse.urlencode(
        {"apiKey": API_KEY, "domainName": domain, "type": rtype}
    )
    url = f"https://api.whoisfreaks.com/v2.0/dns/live?{qs}"
    try:
        with urllib.request.urlopen(url, timeout=60) as r:
            return json.load(r), 200
    except urllib.error.HTTPError as e:
        return None, e.code

def snapshot(payload):
    """Record type -> set of rawText strings."""
    out = {}
    for rec in payload.get("dnsRecords", []):
        out.setdefault(rec["dnsType"], set()).add(rec["rawText"])
    return out

def check(domain):
    payload, code = fetch(domain)

    if code == 404:
        print(f"{domain}: does not exist; nothing to resolve, not a change")
        return
    if payload is None:
        print(f"{domain}: lookup failed (HTTP {code}), keeping previous state", file=sys.stderr)
        return

    now  = snapshot(payload)
    path = STATE / f"{domain}.json"

    if not path.exists():
        STATE.mkdir(exist_ok=True)
        path.write_text(json.dumps({k: sorted(v) for k, v in now.items()}))
        print(f"{domain}: baseline stored ({sum(len(v) for v in now.values())} records)")
        return

    prev = {k: set(v) for k, v in json.loads(path.read_text()).items()}

    for dns_type in sorted(set(prev) | set(now)):
        added = now.get(dns_type, set()) - prev.get(dns_type, set())
        removed = prev.get(dns_type, set()) - now.get(dns_type, set())
        for r in sorted(removed):
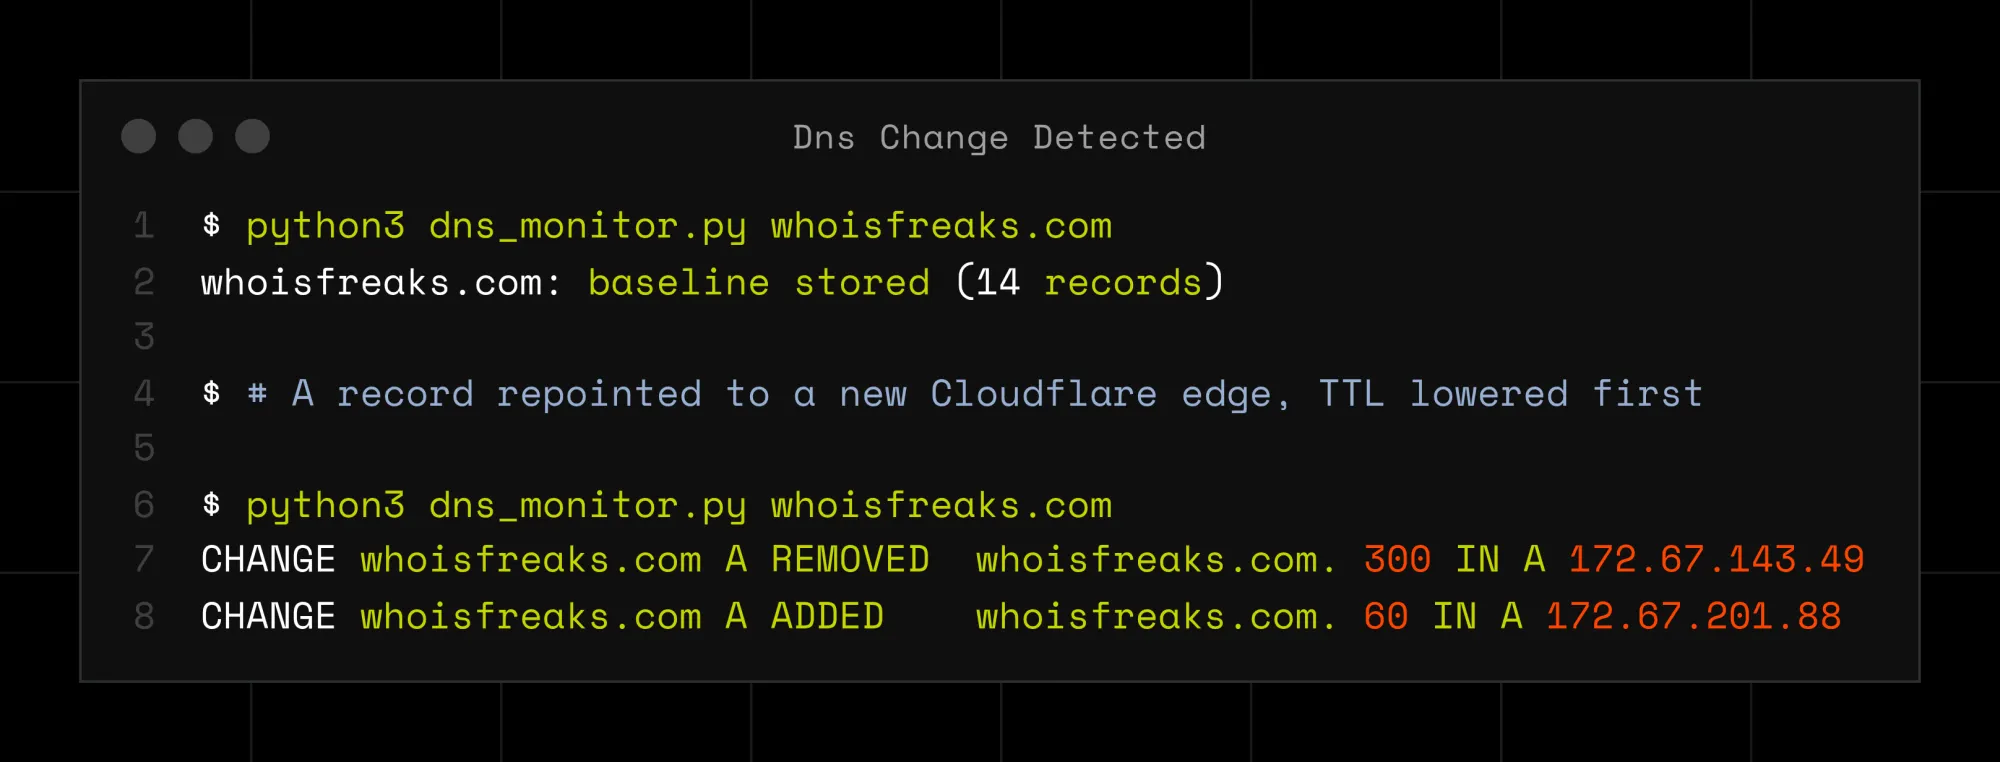
            print(f"CHANGE {domain} {dns_type} REMOVED  {r}")
        for r in sorted(added):
            print(f"CHANGE {domain} {dns_type} ADDED    {r}")

    path.write_text(json.dumps({k: sorted(v) for k, v in now.items()}))

for d in sys.argv[1:]:
    check(d)
Two guards in there; matter as much as the diff. A failed lookup must not overwrite stored state, or one bad request becomes a false "everything was removed" alert now and "everything was added" next run. And a 404 carrying "Entered Domain does not exist" means there is nothing to resolve; that is the right answer, not a deletion. The live DNS response has no registration flag, so existence is signaled by the HTTP status code; if you need a definitive registered-or-not answer, that comes from a WHOIS lookup (domain_registered, the string "yes" or "no") or the Domain Availability API.
Nothing in the API decides this for you, and polling frequency is what drives your credit consumption. One domain checked hourly is 24 lookups a day; a hundred domains checked every ten minutes is 14,400. Per-call costs are listed in the credit usage documentation; check your balance before committing to a schedule.
| What you're watching | Interval | Reasoning |
| Your own production domains | 5-15 minutes | You want to know about an unauthorised change before your users do. |
| Customer or partner domains | 1-6 hours | Changes are planned and rarely urgent for you. |
| Domains in an investigation | 10-30 minutes | Infrastructure moves fast, and a low TTL is a hint it's about to. |
| A large watchlist | 12-24 hours | Coverage beats latency once the list is long. |
Anchor the interval to the records' own TTLs. The sample domain publishes A records at a 300-second TTL and NS records at 21600; polling every minute cannot see a change sooner than the authoritative side publishes it, so it mostly buys extra credit spend.
Any scheduler will do. A cron entry is enough:
*/15 * * * * WF_API_KEY=... /usr/bin/python3 /opt/dns-monitor/check.py example.com >> /var/log/dns-monitor.log 2>&1Looping the live endpoint over 80 domains means 80 requests against the live rate limit. The bulk endpoint does it in one:
curl -L "https://api.whoisfreaks.com/v2.0/dns/bulk/live?apiKey=API_KEY&type=all&format=json" --header "Content-Type: application/json" --data '{"domainNames": ["whoisfreaks.com","jfreaks.com"],"ipAddresses": ["1.1.1.1","8.8.8.8"]}'
Two hard limits shape how you batch. A bulk list caps at 100 items; a longer list returns 413 with "The requested list size is [GREATER_THAN_100] which exceeds the maximum list size of 100." And bulk has its own rate limit, separate from live: on the free tier that's 5 requests per minute against 10 for live, since limits are enforced per endpoint category rather than globally.
Feed each domain's records through the same snapshot() and set-difference logic; the record objects are identically shaped, so nothing in Step 3 changes.
Your monitor's history starts the day you run it. The historical endpoint fills in what came before:
curl -L "https://api.whoisfreaks.com/v2.0/dns/historical?apiKey=API_KEY&domainName=whoisfreaks.com&type=all&page=1"
{
  "totalRecords": 69,
  "totalPages": 1,
  "currentPage": 1,
  "historicalDnsRecords": [
    {
      "queryTime": "2024-04-01",
      "domainName": "whoisfreaks.com.",
      "dnsTypes": { "A": 1 },
      "dnsRecords": [
        {
          "name": "whoisfreaks.com",
          "dnsType": "A",
          "ttl": 3600,
          "rawText": "whoisfreaks.com.\t3600\tIN\tA\t139.144.20.35",
          "address": "139.144.20.35"
        }
      ]
    }
  ]
}
Each entry carries its own queryTime, so sort the snapshots by date and run the same set-difference between consecutive ones to reconstruct a change log. The snapshots are observation-based and irregularly spaced; the sample jumps from 2024-04-01 to 2024-05-07 to 2025-02-07; so, read them as "the record looked like this on that date", not as a fixed-interval feed. Walk page=1..n using totalPages, and remember the historical category carries the tightest rate limit: 1 request per minute on the free tier.
History is also how you sanity-check an alert: if your monitor flags an NS change, it tells you whether that's the domain's first delegation move in two years or its fourth this month. How to Check DNS History and Historical DNS Records for Any Domain Names covers the endpoint in depth.
An alerting system that fires on its own errors gets muted, and a muted monitor is worse than none. Three cases to handle explicitly:
x-ratelimit-allowed-requests, x-ratelimit-remaining-requests and x-ratelimit-remaining-time (in nanoseconds), so sleep for the remaining time and resume. 4xx responses do not consume credits, so a throttled run costs you nothing but the delay.dnsRecords array is an answer, not a deletion. A domain with no mail service has no MX records, and that isn't a change when it was already true yesterday. A name that has stopped existing returns 404 instead, which the guard above already keeps out of your state file.One last source of noise: the SOA serial increments on every zone edit, so diffing rawText on SOA reports a change whenever anything in the zone is touched. Keep it for maximum sensitivity or exclude SOA from alerting.
| Step | Action |
| 1 | Copy your API key and put it in an environment variable |
| 2 | Capture a baseline with GET /v2.0/dns/live and type=all |
| 3 | Diff rawText as a set, grouped by dnsType |
| 4 | Pick a polling interval anchored to the records' TTLs, knowing it drives credit use |
| 5 | Batch up to 100 domains per call on /v2.0/dns/bulk/live |
| 6 | Backfill and corroborate with /v2.0/dns/historical |
| 7 | Never overwrite state on a failed lookup; back off on 429 |
That's a complete DNS monitor: one endpoint, one field to diff, one state file. For the field-by-field reference behind every record type, for the full parameter list, see the DNS API documentation and the DNS Checker API product page.
No. Domain Monitoring compares WHOIS fields, so it catches a name_servers delegation change but not A, AAAA, MX, TXT, SPF, CNAME or SOA records. For those, poll the DNS API on your own schedule and diff the results.
Domain monitoring watches the registration: owner, registrar, expiry, status codes. DNS monitoring watches the configuration: where the domain points, which mail servers accept its email, what text records it publishes.
Use rawText. It's present on every record type and holds the record exactly as DNS returned it, so one rule covers everything. Diffing parsed fields means a separate rule per type and missing any type you forget.
Yes, since the TTL is part of rawText. That's usually useful, as operators often lower a TTL before moving infrastructure. Strip the TTL from the string before comparing if you'd rather ignore it.
Use /v2.0/dns/bulk/live, which takes up to 100 domains per request; longer lists return 413. Bulk has its own limit, separate from live: 5 requests per minute against 10 on the free tier.
You get a 429, which costs no credits. Read x-ratelimit-remaining-time (nanoseconds), sleep, and resume. Don't update your baseline on a throttled run, or the next run will report changes that never happened.
Yes, via /v2.0/dns/historical. It returns snapshots grouped by queryTime, so you can sort and diff consecutive entries. Snapshots are observation-based, and this category is limited to 1 request per minute on the free tier.
It varies by endpoint and plan; see the credit usage documentation. Plan for the multiplier: cost-per-call times domains times checks per day, so your polling interval matters most.
Diff on rawText and compare it as a set rather than a list. It is the only field present for every record type, it preserves the exact form DNS returned, and set comparison avoids the phantom changes you get when a multi-record type comes back in a different order.
Never overwrite your stored baseline on a failed or non-success response. Doing so turns a single network error into two false alerts; one claiming every record vanished, the next claiming every record appeared and that is how monitors get muted.
Run a PTR lookup with the WhoisFreaks DNS API, then use the reverse DNS index to find every domain whose A, MX, NS, TXT or SOA records point at an IP.
10 min read
Run a DNS lookup on any domain with the WhoisFreaks DNS API. Get A, AAAA, NS, MX, TXT, SOA and SPF records in one JSON response, with cURL examples you can copy.
11 min read